FORECAST - FORecasting Energy Consumption Analysis and Simulation Tool
Short overview
The FORECAST model is designed as a tool that can be used to support strategic decision making. Its main objective is to support scenario design and analysis for the long-term development of energy demand and GHG emissions for the industry, residential and tertiary sectors at country level. FORECAST considers a broad range of mitigation options to reduce CO2 emissions, combined with a high level of technological detail. It is based on a bottom-up modelling approach considering the dynamics of technologies and socioeconomic drivers. Technology diffusion and stock turnover are explicitly considered to allow insights into transition pathways. The model further aims to integrate different energy efficiency and decarbonisation policy options and allows to address research questions related to energy demand including the analysis of scenarios for future demand of individual energy carriers like electricity or natural gas, calculating energy saving potentials and impact on GHG emissions as well as abatement cost curves, ex-ante policy impact assessments and the investigation of long-term sustainable energy transition scenarios (Fleiter et al., 2018 and Herbst et al., 2017).
Key features of the FORECAST model
Model structure
The FORECAST platform comprises three individual modules (see the figure below), each representing one sector according to the Eurostat energy balances: industry, services/tertiary and residential. While all sector modules follow a similar bottom-up methodology, they also consider the particularities of each sector like technology structure, heterogeneity of actors and data availability.
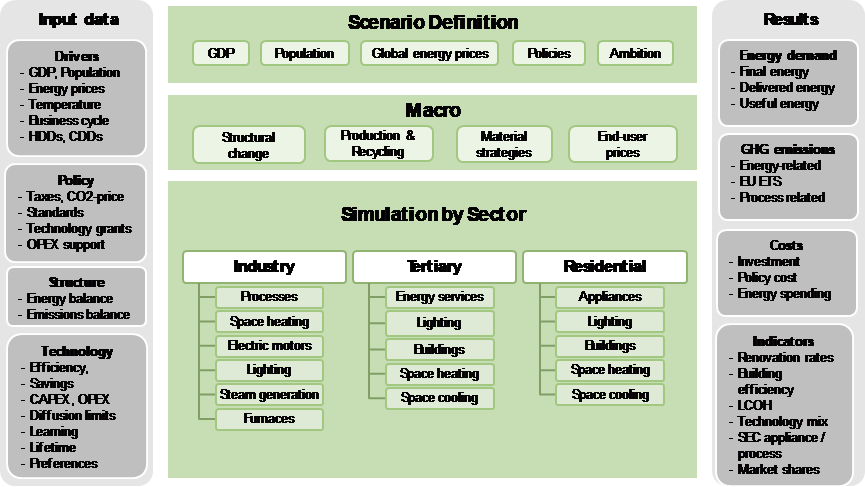
Overview of the FORECAST model structure Source: FORECAST
The list of selected input data provides an idea of the level of detail of each module. Each sector requires sector specific activity data, like industrial production in the industry sector, number of employees in the services sector and number of households in the residential sector. These can either be retrieved from external sources or derived within the macroeconomic module of FORECAST, based on available GDP and population projections from other models or studies. Furthermore, end-consumer energy prices play an important role in each sector and are distinguished by energy carrier (e.g. electricity, coal, oil, natural gas, biomass and district heating). These too can either be retrieved from external sources or derived within the macroeconomic module of FORECAST based on available wholesale price projections for electricity, coal, oil, and natural gas. The third group of input data, the technology characterisation also reflects data availability of the individual sectors. While in the industry and tertiary sector the model works with so-called energy-efficiency measures (EEMs), which represent all kinds of actions that reduce energy consumption, in the residential sector the stock of alternative appliances and the market share of different efficiency classes is explicitly modelled. In all cases, energy savings can be calculated and traced back to technological dynamics including cost considerations.
Geographical coverage and time-horizon
The model system has been developed for the EU-28 plus Norway and Switzerland, but has also been applied in international studies for Turkey, Brazil and Taiwan (Bastos et al., 2017; Huang et al., 2016 and Elsland et al., 2014). The model delivers annual results at country-level up to 2050.
Model result granularity
As an outcome of the bottom-up approach modelling results can be disaggregated with a very high resolution, comprising sectors and sub-sectors, but also end-use technologies and energy carriers. Examples for these fields are shown in the following figure.
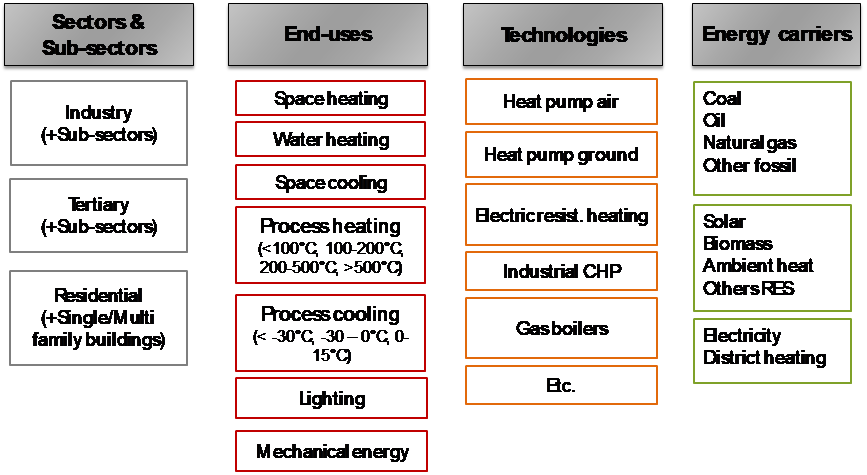
Disaggregation of FORECAST results Source: FORECAST
A list of technologies considered in the model is provided in the following table, showing its high level of technological detail. FORECAST considers all major tertiary and household appliances and a large variety of different heating technologies for buildings (also by sub-sector). In the industry sector, in addition to the differentiation by sub-sector and energy carrier, the most important energy-intensive products are implemented in the model and further differentiated by production process. Depending on data availability, processes can consist of small individual production steps (e.g. burning of clinker in the cement industry) or entire production lines for individual products or product groups (e.g. bricks, ceramic tiles).
| Industry | Buildings (tertiary and residential) | Appliances (tertiary and residential) |
|---|---|---|
|
|
|
Source: FORECAST
The production of steel, for example, is differentiated in: coke oven, sinter, blast furnace and converter, electric arc furnace, H2 plasma (steel), DR H2 + EAF (steel), DR electrolysis (steel), DR natural gas (steel) and rolled steel. In total, FORECAST currently considers more than 80 processes and 200 different saving options are modelled in the industry sector.
Methodology
Industry
The industry model distinguishes nine sub-sectors (iron and steel, non-ferrous metals, paper and printing, non-metallic minerals, chemicals, food and drink and tobacco, engineering and other metal, other non-classified, and refineries), more than 80 process technologies and a variety of cross-cutting technologies. The main macro-economic drivers are industrial production for basic material products, gross value added for less energy-intensive sub-sectors and employment numbers. Five sub-modules cover: basic materials processes, space heating, electric motor systems, furnaces and steam systems. For each process, saving options are defined, reducing the specific energy consumption and process-related GHG emissions by diffusing through the technology stock. Diffusion depends on boundaries and payback time. The payback time in turn is determined by end-consumer energy prices, European Union Allowance (EUA) prices and the saving potential (for details see Fleiter et al., 2018).
Tertiary
The tertiary model distinguishes eight sub-sectors (trade, hotel and restaurants, traffic and data transmission, finance, health, education, public administration and other) and various end-uses as shown in the previous table. To derive future energy demand, an annual energy service driver is multiplied by the annual specific energy demand per unit of driver. For example, the electricity demand for space cooling can be calculated using the specific energy demand per m² floor area cooled and the quantity of the given driver, here the share of cooled floor area per employee. This is in turn driven by employment in the tertiary subsectors. The diffusion of energy efficiency measures depends on the cost-effectiveness of efficiency alternatives or efficiency add-on measures (see section 3.4; for more details see Jakob et al. (2012) and Jakob et al., 2013).
Residential
The residential model separates household energy demand into four sub-groups (appliances and lighting, sanitary hot water, space heating, new and others), which are reflected by various end-uses (see previous table). The end-uses are further broken down into technologies, and each technology is distinguished by various efficiency classes. The calculation of energy demand in the residential sector is structured as follows: the majority of final residential energy demand is attributed to space heating. The useful heat demand is calculated in a first step based on a detailed representation of the European building stock. The model is designed as a vintage stock model that captures the number of end-uses in the market in combination with their age distribution. For heating systems, the vintage stock is represented by market shares. Technology diffusion depends on the relative cost advantages of substitution alternatives. The cheaper an alternative is, the larger its market share in the corresponding year (for details see Elsland, 2016).
Modelling investment decision
The bottom-up approach, which distinguishes individual technologies, allows modelling the diffusion of technologies as the result of individual investment decisions taken over time. For all types of investment decisions, the model follows a simulation approach rather than optimisation in order to better capture the real-life behaviour of companies and households.
Whenever possible, the investment decision is modelled as a discrete choice process, where households or companies choose among alternative technologies to satisfy a certain energy service. It is implemented as a logit approach considering the total cost of ownership (TCO) of an investment plus other intangible costs. This approach ensures that even if one technology choice is more cost-effective than others, it will not gain a 100% market share. This effect reflects heterogeneity in the market, niche markets and non-rational behaviour of companies and households, which is a central capability to model policies. Still, the resulting technology development (and energy demand) is price sensitive.
The replacement of equipment/buildings/technologies is based on a vintage stock approach allowing to realistically model the replacement of the capital stock considering its age distribution. Some parts of the industrial and the tertiary sector are not using a vintage stock approach, due to the huge heterogeneity of technologies on the one hand and data scarcity on the other. Technology diffusion, however, is modelled based on a similar simulation algorithm taking heterogeneity and non-rational behaviour into account.
Modelling policies
Modelling energy-efficiency policies is a core feature of the FORECAST model. The simulation algorithm and the vintage stock approach are well suited to simulate most types of policies.
Minimum energy performance standards (MEPS), e.g. for appliances or buildings, can easily be modelled by restricting the market share of new appliances starting in the year the standards come into force. See Elsland et al. (2014) and Jakob et al. (2013) for examples of ex-ante impact assessments of the EU-Ecodesign Directive.
Energy taxes for end-consumers can be modelled explicitly on the basis of more than ten individual energy carriers (electricity, light fuel oil, heavy fuel oil, natural gas, lignite, hard coal, district heating, biomass, etc.).
Information-based policies are generally the most complicated to model due to their rather “qualitative character”. The discrete-choice approach, however, allows to consider such qualitative factors. For example, labelling of appliances resulting from the EU Labelling Directive can be modelled by adjusting the logit parameters and thus assuming a less heterogeneous market, in which a higher share of consumers select the appliance with the lowest total cost of ownership. See for example (Elsland et al., 2013).
EU emissions trading can be modelled in the form of a CO2 price for energy-intensive industries. The detailed technology disaggregation in the industrial sector considering more than 80 individual products and processes allows to consider the scope of the EU ETS on a very detailed level. A combined discrete choice and technology vintage model simulates the change in steam generation technologies as a function of technology parameters, demand, prices and policies.
Key data sets
The main inputs for model calibration like energy balances, employment, value added or energy prices are calibrated to the most recent EUROSTAT statistics whenever possible. The same holds true for main model drivers like GDP and population. When such data is not available (e.g. prices for certain energy carriers) other data (e.g. IEA) is used to fill the gaps. The current model version is calibrated on the year 2015.
In the following, an overview of the main sources is provided by model segment for technology-related data not available in EUROSTAT:
Buildings and heating systems: Buildings Performance Institute Europe (BPIE), IEE project TABULA, IEA Building Energy Efficiency Policies (BEEP), IEE project EPISCOPE, ODYSSEE database, country specific research e.g. for heat pumps.
Appliances residential sector: Ecodesign Directive preparatory studies, ODYSSEE database, market research data from GfK.
Appliances tertiary sector: Ecodesign Directive preparatory studies and additional individual technology studies.
Industrial production: Industry organisations (World steel association, CEPI, Cembureau, Eurochlor, etc.), US geological survey, UNFCCC, UN commodity production database, PRODCOM when possible.
Industry cross-cutting technologies: generated in various technology studies of which many are EU projects (external and in-house).
Industry process technologies: IPPC BREF studies, numerous technology/sectoral studies (external and in-house).
Besides these sources, many more, even country specific sources, statistics and reports are used to feed the model database.
Recent publications using the FORECAST model
| Industry | Buildings (tertiary and residential) | Appliances (tertiary and residential) |
|---|---|---|
| Industrial Innovation: Pathways to deep decarbonisation of industry Fleiter et al., 2019 | Detailed analysis using FORECAST of industrial mitigation pathways considering best available and innovative mitigation technologies for the EU28. | All scenarios show that an ambitious improvement in energy efficiency can reduce the costs of decarbonisation and make substantial contributions to CO2 savings over the next 10 to 20 years in particular. However, that alone is not enough to reduce emissions sufficiently. A decisive factor is the rapid expansion of renewable energies in order to generate CO2-free electricity. This is particularly important because electricity consumption in the industrial sector could rise sharply by 2050 - doubling or even tripling depending on the scenario. This would happen above all if electricity were increasingly used for process heat generation and important processes in the chemical and steel industries were converted to electrolysis hydrogen. A 95 percent reduction in greenhouse gases and thus almost CO2-neutral industrial production by 2050 requires fundamental changes along the value chain. These include the spread of low-CO2 cement types, efficient use of materials and a comprehensive recycling economy. The capture and storage of CO2 can also play a role, for example in reducing remaining emissions during the production of cement clinker and lime |
| REFLEX - Analysis of the European energy system under the aspects of flexibility and technological progress (publication available in 2020) www.reflex-project.eu | Detailed analysis of residential, tertiary, and industrial mitigation pathways in a centralised and decentralised energy system under the consideration of flexibility options (eLOAD) for the EU28. | Electrification and the use of hydrogen are promising decarbonisation options for the demand-side sectors transport and industry. In a decentralised system with volatile renewable energy sources, flexibility potentials play an important role for secure and cost-efficient electricity supply. On the demand-side, the diffusion of decentralised batteries as part of PV systems and in electric vehicles as well as hydrogen production by electrolysers could provide necessary flexibility for the electricity system |
| SET-Nav -Navigating the Roadmap for Clean, Secure and Efficient Energy Innovation Hartner et al., 2019 www.set-nav.eu | The main objective of the simulation of energy in industrial processes has been to set-up a modelling framework that allows simulating the transition to a low-carbon energy system for the industrial sector in an integrated manner. Technology solutions like innovative process technologies, fuel switch to RES, energy efficiency, CCS and the links to the power and gas sectors have been considered using the bottom-up model FORECAST. |
The analysis has shown that mitigation levels in industry of more than 80% can only be achieved by either the use of CCS (also for smaller point sources) and/or the implementation of various types of mitigation options including energy-efficient and low-carbon production innovations, RES-based electricity and hydrogen (also as feedstock for the chemical industry), a comprehensive circular economy and improvements in material efficiency. Todays available technologies are insufficient for deep decarbonisation. The remaining energy efficiency potentials due to applying BAT are limited and fuel switching from fossil fuels such as natural gas to RES is often not possible due to the high temperature levels required in industrial furnaces and the competition for biomass with other sectors. In addition, process emissions from chemical reactions within production processes pose a special challenge for the sector as they are difficult or even impossible to mitigate with today's productions processes and products. Consequently, the current policy mix needs to be adjusted in order to effectively support R&D activities directed at the decarbonisation of industrial production. |
| HotMaps - A unique tool for heating and cooling planning www.hotmaps-project.eu | Development of generic data for specific heating and cooling demand in industry and for technologies in steam generation based on FORECAST. Data collection on heating and cooling demand of energy intensive plants. Data collection regarding the heat supply mix for decentralised heating and cooling systems and district heating and cooling. Development of industrial heat demand and waste heat integration module. |
|
| Heat Roadmap Europe – A low-carbon heating and cooling strategy for Europe (HRE4) www.heatroadmap.eu | Modelling of the buildings and industry sectors, and the effect and cost of energy efficiency measures in buildings with FORECAST to generate detailed heating and cooling demand profiles, for the residential, industry and service sector which are used to further calibrate the heating and cooling demands in Pan-European Thermal Atlas and to better understand the possibilities for energy efficiency on the demand side. | Decarbonising heating and cooling requires energy efficiency on both demand and supply sides of the heat sector. Heat savings can cost-effectively reduce the total heat demand in Europe by approximately 30-50%. District heating can capture excess heat, which is currently being wasted, and can replace fossil energy sources to heat EU cities. Based on cost and energy considerations, district heating should increase from today’s level of 10% up to 50% by 2050. Large heat pumps and other proven technologies can provide next generation district heating with renewable heat |
References
Fleiter, T., Rehfeldt, M., Herbst, A., Elsland, R., Klingler, A.-L., Manz, P., & Eidelloth, S. (2018). A methodology for bottom-up modelling of energy transitions in the industry sector: The FORECAST model. Energy Strategy Reviews, 22, 237-254. doi:10.1016/j.esr.2018.09.005
Herbst, A., Fleiter, T., Elsland, R., Rehfeldt, M., & Reiter, U. (2017). Benchmarking the EU reference scenario 2016: An alternative bottom-up analysis of long-term energy consumption in Europe. ECEEE Summer Study Proceedings, (pp. 159-169).
Bastos, B. Q., Souza, R. C., Calili, R. F., Oliveira, F. L., Catenazzi, G., & Jakob, M. (2017). Modeling the impact of energy efficiency in the electricity consumption of the Brazilian tertiary sector. 2017 14th International Conference on the European Energy Market (EEM). IEEE. doi:10.1109/eem.2017.7982003
Huang, Y.-H., Chang, Y.-L., & Fleiter, T. (2016). A critical analysis of energy efficiency improvement potentials in Taiwans cement industry. Energy Policy, 96, 14-26. doi:10.1016/j.enpol.2016.05.025
Elsland, R., Bradke, H., & Wietschel, M. (2014). A European Impact Assessment of the Eco-design Requirements for Heating Systems – What Kind of Savings can we Expect? Energy Procedia, 62, 236-245. doi:10.1016/j.egypro.2014.12.385
Fleiter, T., Rehfeldt, M., Herbst, A., Elsland, R., Klingler, A.-L., Manz, P., & Eidelloth, S. (2018). A methodology for bottom-up modelling of energy transitions in the industry sector: The FORECAST model. Energy Strategy Reviews, 22, 237-254. doi:10.1016/j.esr.2018.09.005
Jakob, M., Fleiter, T., Catenazzi, G., Hirzel, S., Reitze, F., & Toro, F. (2012). The impact of policy measures on the electricity demand of the tertiary sector of the European Union: An analysis with the bottom-up model FORECAST. 7th International Conference on Improving Energy Efficiency in Commercial Buildings · IEECB 2012.
Jakob, M., Catenazzi, G., & Fleiter, T. (2013). Ex-ante estimation of the EU Ecodesign Directive’s impact on the long-term electricity demand of the tertiary sector. Eceee summer study 2013, June 3-8, Presqu'ile de Giens.
Elsland, R., Schlomann, B., & Eichhammer, W. (2013). Is enough electricity being saved? Impact of energy efficiency policies addressing electrical household appliances in Germany until 2030. Eceee summer study 2013, June 3-8, Presqu'ile de Giens.
Fleiter, T., Herbst, A., Rehfeldt, M., & Arens, M. (2019). Industrial Innovation: Pathways to deep decarbonisation of Industry. Part 2: Scenario analysis and pathways to deep decarbonisation. Tech. rep., Fraunöher ISI and ICF.
Hartner, M., Herbst, A., Heitel, S., Fleiter, T., Rehfeldt, M., Forthuber, S., Kranzl, L., Fritz, S., Aichinger, E., Müller, A., Krail, M., Köhler, J., Bernath, C. and Sensfuß, F. (2019). WP5 Summary Report - Energy Systems: Demand perspective. H2020 research project SET-Nav Summary Report D5.8.
